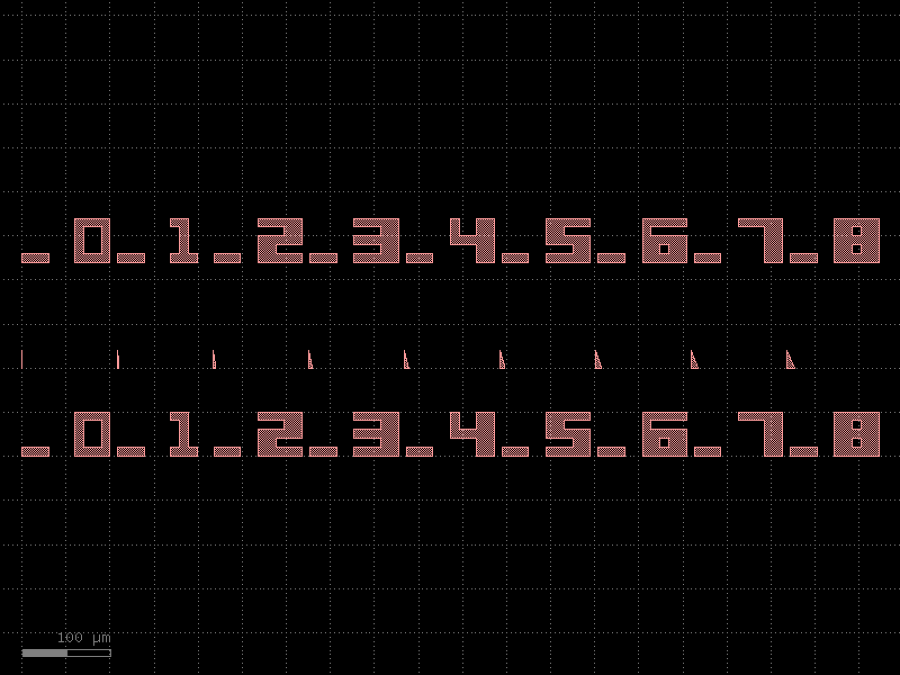
- gdsfactory.grid_with_text(components: Sequence[str | Callable[[...], Component] | dict[str, Any] | DKCell] = ('rectangle', 'triangle'), text_prefix: str = '', text_offsets: Sequence[tuple[float, float]] | None = None, text_anchors: Sequence[Literal['ce', 'cw', 'nc', 'ne', 'nw', 'sc', 'se', 'sw', 'center', 'cc']] | None = None, text_mirror: bool = False, text_rotation: int = 0, text: str | Callable[[...], Component] | dict[str, Any] | DKCell | None = 'text_rectangular', spacing: tuple[float, float] | float = (5.0, 5.0), shape: tuple[int, int] | None = None, align_x: Literal['origin', 'xmin', 'xmax', 'center'] = 'center', align_y: Literal['origin', 'ymin', 'ymax', 'center'] = 'center', rotation: int = 0, mirror: bool = False, labels: Sequence[str] | None = None)Component
Returns Component with 1D or 2D grid of components with text labels.
- Parameters
components– Iterable to be placed onto a grid. (can be 1D or 2D).text_prefix– for labels. For example. ‘A’ will produce ‘A1’, ‘A2’, …text_offsets– relative to component anchor. Defaults to center.text_anchors– relative to component (ce cw nc ne nw sc se sw center cc).text_mirror– if True mirrors text.text_rotation– Optional text rotation.text– function to add text labels.spacing– between adjacent elements on the grid, can be a tuple for different distances in height and width.shape– x, y shape of the grid (see np.reshape).align_x– x alignment along (origin, xmin, xmax, center).align_y– y alignment along (origin, ymin, ymax, center).rotation– for each component in degrees.mirror– horizontal mirror y axis (x, 1) (1, 0). most common mirror.labels– list of labels for each component.
import gdsfactory as gf

components = [gf.components.triangle(x=i) for i in range(1, 10)]
c = gf.grid_with_text(
    components,
    shape=(1, len(components)),
    rotation=0,
    mirror=False,
    spacing=(100, 100),
    text_offsets=((0, 100), (0, -100)),
    text_anchors=("nc", "sc"),
)
c.plot()